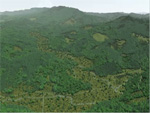
VNS Flythrough of the 5 Rivers watershed (1996)
Located in the central coast range of Oregon, this animation moves up Lobster Creek
showing a photo-realistic representation of CLAMS GIS data for 1996. Vegetation species, size and density are based on the CLAMS GNN database. The terrain, streams and roads are also projected from GIS databases. - Quicktime 4mb
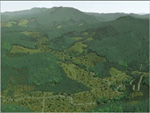
VNS Flythrough of the 5 Rivers watershed (Sim Year 100)
Similar to the 1996 animation, this projection is based on CLAMS generated data. A simulation of the landscape 100 years in the future, this LAMPS projection models landowner behavior and forest growth. - Quicktime 4mb
VNS 100 year time lapse of the 5 Rivers watershed A landscape in motion. This animation shows forest landuse change over 100 years in the Oregon Coast Range. Watch vegetation landscape patterns emerge from contrasting forest management strategies. - Flash 18mb
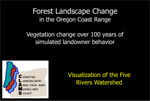
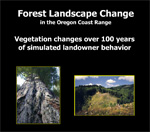
Forest Landscape Change in the Oregon Coast Range.
Vegetation changes over 100 years of simulated landowner behavior. This animation features five watersheds in the CLAMS area and shows landscape change over time with 2D maps. Flash Player 7 or better required. **49mb**
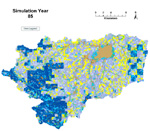
Vegetation Class Map Animations
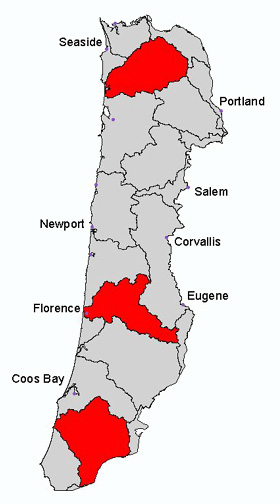
Five different 5th-field watersheds in the Oregon Coast Range are shown as animated vegetation class maps. Based on current policy, these LAMPS projections show possible landscape change over 100 years. Watch for emerging vegetation contrast over time. (Flash Player version 7 or greater required)