 Viewing
Results
Viewing
Results


|
|
The Output Summary Window is displayed after FishXing finishes the calculations. FishXing provides a variety of ways to view and report the results. By using the Navigation Bar you can select from Tabular and Graphical forms of output and reports.
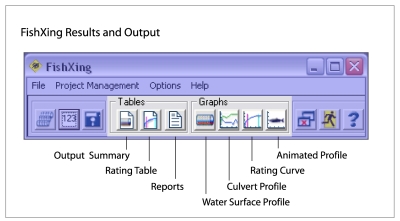
The results are also available through the Graphs and Tables menu bar on the Output Summary:

FishXing Output and Results:
The Output Summary Is the primary results window. It contains a summary of fish passage conditions and barriers, key hydraulic parameters for the, detailed hydraulic conditions through the culvert and a flow calculator for additional flows.
Provides hydraulic and passage information about the crossing with respect to flow as the independent variable.
· Reports
All of the input data and output results can be printed in a customizable report form and saved as an Rich Text Format (*.rtf) file for import into spreadsheet and word processor applications.
Graph of the culvert, Water Surface, Critical Depth, Normal Depth, Headwater and Tailwater down the length of the culvert.
Display of data down the length of the culvert. Showing hydraulic conditions and fish performance with respect to the culvert bottom.
Using the numerical results of the model FishXing provides an animated "dramatization" of the hydraulics and fish performance within the culvert.
![]() FishXing Version 3.0 Beta, 2006
FishXing Version 3.0 Beta, 2006