 Culvert Report


|
|
With FishXing you have the ability to create a summary report customized according to your data requirements. This custom report can include text, tables, graphs and pictures.
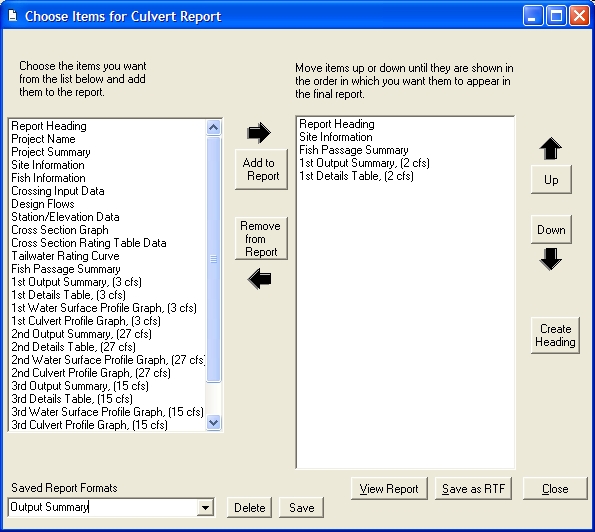
Choosing and arranging items for your report
When you choose Report on the Navigation Bar or Main Menu a list of items that are appropriate for this crossing will appear. You can select any of the items by highlighting the topic in the left panel and pressing Add to Report. An item can be selected more than once. Once items are selected they can be reordered as desired by selecting them and choosing the Up and Down buttons.
See also: Customizing Tables and Graphs
Viewing Reports
View Report – After choosing and ordering report items press View Report. This will generate a report on screen in a new window. The report cannot be edited, but several options are available for formatting:
Edit Headers where you can type custom headers and footers and page numbers that will appear on each page.
Page Setup where you can change the paper size, orientation, and margins.
Save as RTF – After choosing and ordering report items press Save as RTF. This will create a document in RTF (Rich Text Format) that can be edited in a word processing program. This option allows you to create reports that are fully customized, and is a good alternative when the Print View formatting is not acceptable.
Saving Report Formats
When you create a report that will be used multiple times you can save the format by choosing Save. Give the format a descriptive name at the prompt and choose Save.
Report Elements
Input
Report Heading: You can create a custom heading for the report by clicking the Create Heading button. If no custom heading is chosen the heading will just say “Crossing Report for …” and the crossing name.
Project Name: Prints the Project Name as selected in the Project Summary Window.
Project Summary: Prints the whole project summary table as it is currently configured in the Project Summary Window.
Site Information: Prints all the input information entered on the Site Information page.
Fish Information: Available when Literature or User-defined Swim Speeds are used. Prints all the information on Fish Swimming abilities shown on the Input Sheet.
Fish Length
Minimum Water Depth
Prolonged Swimming Speed
Prolonged Time to Exhaustion
Prolonged Notes
Burst Swimming Speed
Burst Time to Exhaustion
Burst Notes
Max Leaping Speed or Max Outlet Drop
Velocity Reduction Factors
Evaluation Criteria: When Hydraulic Criteria are used, reports the criteria used in this analysis, including Maximum Allowed Water Velocity, Minimum Required Depth, Maximum Allowed Outlet Drop, Notes.
Crossing Input Data: Prints all the data associated with the culvert or culverts in the crossing. For each culvert in the crossing the following are reported.
Culvert Shape and Size
Material
Installation / Countersunk Depth
Natural Bottom Roughness Coefficient
Length / Slope
Culvert Roughness Coefficient
Inlet Invert Elevation
Outlet Invert Elevation
Inlet Headloss Coefficient (Ke)
Design Flows: Prints Low and High Fish Passage Flow rates.
Tailwater and Cross Section Information: Depending on which Tailwater Method is selected, the report will list inputs used to determine tailwater conditions, rating curves and cross section data in table and graph format.
Output
Fish Passage Summary: Prints the Fish Passage Summary Table as shown on the Output Summary window.
1st Output Summary: Prints the Summary table for Low Fish Passage Flow rate as shown on the Output Summary window.
1st Details Table: Prints the Details table for Low Fish Passage Flow rate as entered on the Output Summary window. Any changes made to the Details Table on the Output Summary window will be reflected the in the report.
1st Water Surface Profile Graph: Prints the Water Surface Profile Graph for Low Fish Passage Flow rate as configured on the Water Surface Profile window.
1st Culvert Profile Graph: Prints the Culvert Profile Graph for Low Fish Passage Flow rate as customized and configured on the Culvert Profiles window.
2nd Output Summary: Prints the Summary table for High Fish Passage Flow rate as shown on the Output Summary window.
2nd Details Table: Prints the Details table for the High Fish Passage Flow rate as customized on the Output Summary window. Any changes made to the customization of the Details Table on the Output Summary window will be reflected in the report.
2nd Water Surface Profile Graph: Prints the Water Surface Profile Graph for High Fish Passage Flow rate as configured on the Water Surface Profile window.
2nd Culvert Profile Graph: Prints the Culvert Profile Graph for High Fish Passage Flow rate as customized and configured on the Culvert Profiles window.
If an additional flow rate was calculated with the Flow Rate Calculator on the Output Summary window, then a 3rd set of tables and graphs will be available for that flow.
Culvert Rating Table: Prints the Culvert Rating Table as customized on the Rating Tables window.
Culvert Rating Curve: Prints the Culvert Rating Curve as customized and configured on the Rating Tables window.
Barrier Codes: Displays a key for the codes used in output for the different type of barriers to fish passage.
Images: Displays images attached to crossing from the Site Information window.
![]() FishXing Version 3.0 Beta, 2006
FishXing Version 3.0 Beta, 2006