 Output Summary Window


|
|
The Output Summary is the first window that appears after calculations are complete and is the primary output window.
The Fish Passage Summary table gives the passage conditions for the range of flows defined by the Low and High Fish Passage flows:
· The High and Low Passage Design Flows
· Percent of the flow range that is passable ( Percent Passage)
· Barriers and flow range associated for each type of barrier
The Flow Summary Table summarizes hydraulic conditions for the current flow:
· Normal, critical, headwater and tailwater depths
· Headwater to Diameter Ratio (HW/D)
· Inlet Velocity
· Swim times and barrier code
The Flow Calculator allows you change the current flow and add an additional check flow to the analysis. The active flow in the Output Summary will be the flow displayed in the Water Surface Profile and Animated Profile.
The Profiles Table reports the results of the hydraulic model fish passage calculations for each flow at the crossing being analyzed. Since passage is not only a function of the outlet condition FishXing allows you to view the conditions inside the length of the culvert. Each variable is calculated for the given flow along the length of the culvert at evenly spaced nodes.
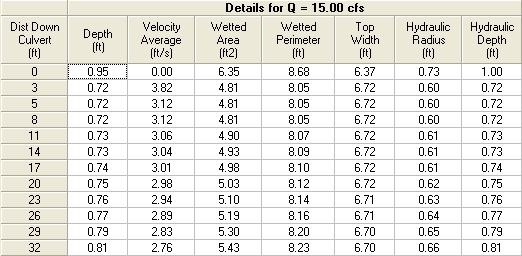
Variables in the Profiles Table:
Dist. Down Culvert
The distance down the culvert, starting at the inlet, is the abscissa (x-axis) of the Output Summary Table. All of the variables are given in reference to where they are calculated along the length of the culvert. Each segment of culvert is known as a node. Calculations are made at each node and reported in the table. This variable is fixed.
Depth
The average depth of water along the length of the culvert. It is a measure of the distance from the culvert bottom to the water surface.
Critical Depth
The depth of critical flow in the culvert at this flow rate. Critical depth is the depth the water would be if inertial and gravitational forces were equal. This value will always remain constant for the entire length of the culvert.
Normal Depth
The depth of normal flow in the culvert at this flow rate. Normal Depth is the depth the water would flow if all the forces on the water were balanced and the depth remained uniform. This value will always remain constant for the entire length of the culvert. See Defining Normal Depth.
Velocity Head
Velocity Head is a measure of the available energy in the water from its velocity.
Velocity - Ave
The cross-sectional average speed of the water at any point along the length of the culvert.
Velocity - Occ
Occupied Velocity is the average water velocity reduced by the velocity reduction factors entered by the user. The FishXing model uses these velocities under the assumption that fish will swim in a zone of reduced water velocity near the edges of the culvert.
Ground Speed
The fish’s speed with respect to the ground accounting for the fish’s swimming speed and the speed of the flowing water.
Swim Mode
Swim mode of the Analysis Fish while in the culvert. Prolonged or Burst.
Prolonged Time
The time that the Analysis Fish spends in Prolonged Swimming Mode as measured from node to node along the length of the culvert.
Burst Time
The time that the analysis fish spends in Burst Swimming Mode (darting speed) as measured from node to node along the length of the culvert.
Barrier Type
A list of reasons why the fish may not be able to negotiate each point along the length of the culvert.
Froude Number
The Froude number, Fr, is a dimensionless value that describes different flow regimes of open channel flow. The Froude number is a ratio of inertial and gravitational forces and is used to classify flow as critical, supercritical or subcritical at a point in the pipe.
When:
Fr = 1, critical flow,
Fr > 1, supercritical flow (fast rapid flow),
Fr < 1, subcritical flow (slow / tranquil flow)
Specific Momentum
See: Specific Force and Momentum
Shear Stress
Shear Stress is a measure of the frictional force of flowing water exerted on the surface of the channel bed. Shear stress is a factor in determining the mobility of a given bed material.
Stream Power
Stream Power measures the work available in flowing water to move stream bed material. Stream power is a useful measure for bed mobility calculations and prediction of erosion potential.
Composite Roughness
For culverts that have a natural bottom or substrate that has a different roughness coefficient from the culvert material roughness is composited using one of three methods described in Composite Roughness Calculations.
Energy Dissipation Factor
EDF represents the amount of energy used per unit of water flowing through the culvert. This parameter is important in the analysis of baffled culverts and roughened channel culverts. EDF represents an energy threshold for the ability of fish to utilize a given volume of water.
Hydraulic Curve
Hydraulic curves, or flow profiles, classify the type of flow in the culvert based on the Water Surface slope.
Wetted Area
The cross-sectional area of water as measured perpendicular to the flow.
Wetted Perimeter
The length of channel or pipe in contact with the water as measured perpendicular to the flow.
Top Width
The width of the water surface as measured perpendicular to the flow. The top width will usually vary with stage.
Hydraulic Radius
The cross sectional area of flow divided by the wetted perimeter.
Hydraulic Depth
The wetted area of flow divided by the top width.
Bottom Elevation
The absolute elevation of the culvert bottom along the length of the culvert measured from the user’s datum.
Water Surface Elevation
The absolute elevation of the water surface along the length of the culvert measured from the user’s datum.
Critical Elevation
The absolute elevation of the critical water depth along the length of the culvert measured from the user’s datum.
EGL Elevation
The absolute elevation of the Energy Grade Line along the length of the culvert measured from the user’s datum.
Water Surface Slope
The slope of the water surface between each node along the length of the culvert.
EGL Slope
The slope of the Energy Grade Line between each node along the length of the culvert.
![]() FishXing Version 3.0 Beta, 2006
FishXing Version 3.0 Beta, 2006