Customizing Tables and Graphs


Customizing Tables and Graphs |
|
All of the Graphs and Tables in FishXing can be customized for use in a variety of different analyses. The customizing procedure is similar for all of the outputs and is described below.
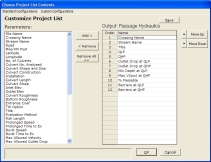
To customize a table or graph press the Customize Button. Select the parameter you would like to display from the Parameters list on left side of the screen and click Add. The parameter will be included in the Output list on the right side. The parameters in the Output list can be re-ordered by selecting the parameter and clicking the Move Up or Move Down button. Select an output parameter and click Remove to de-select it from the output list. When the parameters are in the desired order click OK to see the results.
Standard Configurations
FishXing comes with certain combinations of parameters already defined for use in common applications which are listed in the Standard Configurations drop down menu. Choosing one of these Standard Configurations will change the list of parameters shown in the Output list.
Custom Configurations
After you have created a list of parameters that you wish to use repeatedly click the Save Button, name your configuration and it will be available in the Custom Configuration drop down menu.
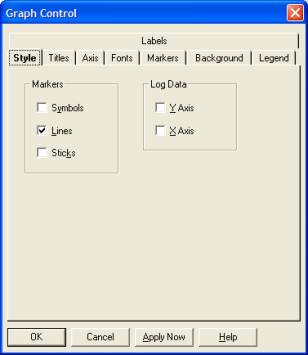
Graph Setup
All output graphs in FishXing can be modified by right clicking on the graph. A window will appear that allows the user to change a number of graph parameters in the current view. Changes will not be applied to other graphs. The original graph layout can be restored by pressing the Graph Defaults Button.
![]() FishXing Version 3.0 Beta, 2006
FishXing Version 3.0 Beta, 2006