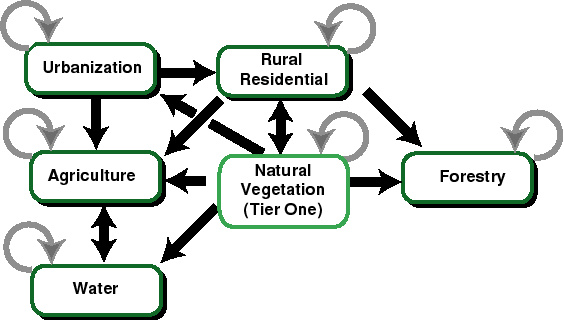
Written scenario assumptions become mapped alternative futures through land allocation modeling. Ultimately allocation means assignment of one of the 65 categories in the legend to each 1/4-acre cell in the digital map, a condition that results from actions within specific models, interactions between the models, and final map assembly. The six resource allocation processes (urbanization, rural development, agriculture, forestry, natural habitats, and surface water withdrawals) are modeled separately, but the models interact. For example, when an urban growth boundary expands, both agricultural land and previously rural residential land may convert to urban. Within the new UGB, agricultural lands may remain agricultural or be converted to urban uses. When that conversion occurs, responsibility for modeling the affected locations shifts from the agricultural model to the urban. The main reason for modeling the phenomena in 10-year time steps is to allow these interactions to occur.
The figure diagrams interactions among the land allocation models. Straight arrows indicate the direction of effect. For example, urbanization may take land away from rural residential use, but there is no alternative future modeled in which rural residential use replaces urban uses. The circular arrows indicate the internal effects on each modelís next time step of the prior steps.
The Conservation 2050 alternative allocates land to natural vegetation, creating groupings of land allocations not present in the other futures. These areas are called Tier One conservation zones. As the diagram shows, these allocations can have complex interactions with the principal processes, at times forcing expansion of UGBs, and therefore conversion of agricultural land to urban uses as an indirect effect, as well as directly converting agricultural lands to various natural vegetation types.
The final step in land allocation
is map assembly, in which the results of the individual allocation models
are combined to produce a time step, for example, 2010 or 2020, of an alternative
future. The individual allocation models produce map layers which are combined
in such a way that overlying uses replace underlying ones if conflicting
types exist for a particular 1/4-acre cell. This process carries out stakeholder-defined
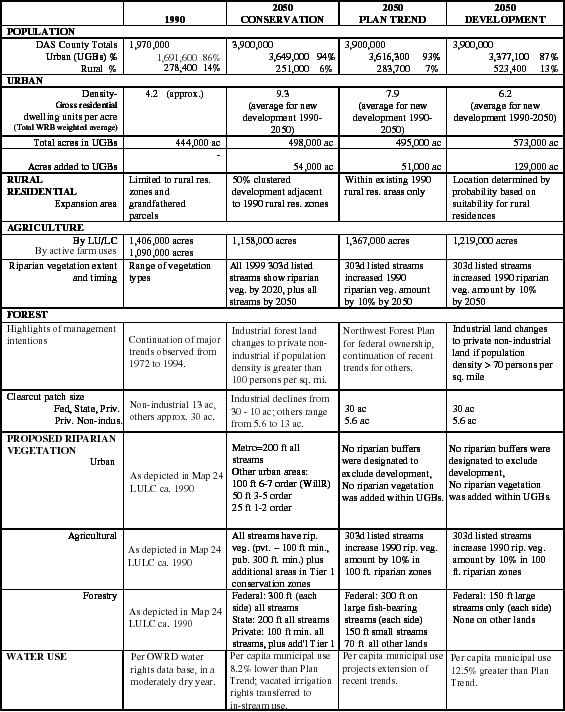
prioritization rules in each of the scenarios, summarized in this table.
In Conservation 2050, for example, agricultural uses are replaced by some
wetland uses, while in Development 2050 the reverse is true.